My experience on my daily works... helping others ease each other

Showing posts with label Data Analytics. Show all posts

Monday, June 1, 2020

Reading entire URL content is really easy using R

In my good old days, reading the entire content of a website is not easy. The process of web scraping and getting the required data requires lots of programming and a few tools. A friend of mine even developed and sold the tool which he called it (during the development) as myrobot. He developed using PHP.

Now, it is much easier and one of the many ways is using R.

Here are the steps (which requires you to write ONLY two lines of code)

  1. Connect to the website using URL command
    con <- url ([the website url], “r”)
  2. Then, read the website
    x <- readLines(con)
  3. Do whatever you wish with the data. In this example, I print out the head of the website and also copy the whole content to a file.
    head(x)
    dput(x, “readFromUrlExample.html”)

There you go.

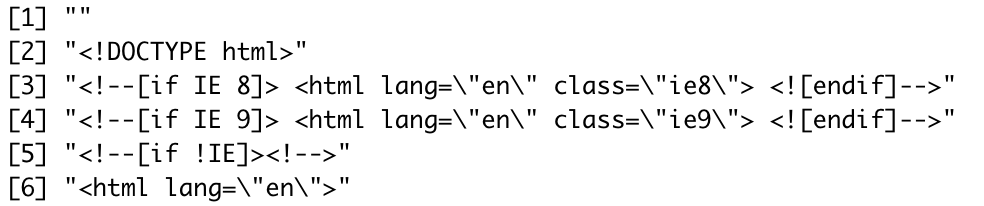
Result of the head(x) function
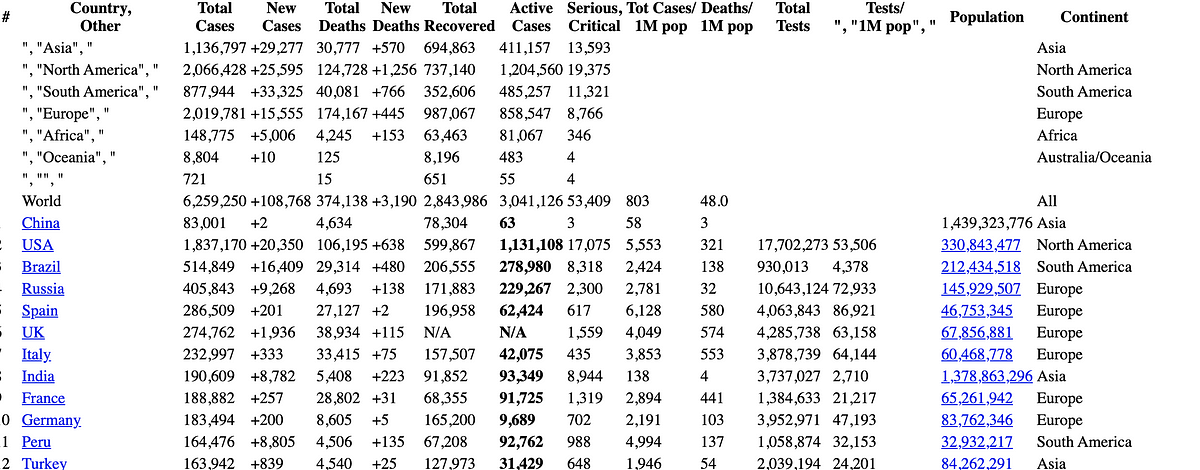
Snapshot of the content of the file copied into readFromUrlExamplehtml

The sample source code can be retrieved at 

https://github.com/masteramuk/LearnR-Coursera/blob/master/sample-ReadFromUrl.R

Share:

Friday, May 29, 2020

Solving Committing Issue between R Studio and Github


Solving Committing Issue between R Studio and Github

In the normal development process, you will create a repo (the repo in this article is located at Github), followed by the cloning process or download as full directory into your localhost. It is much easier and straightforward. There won’t be any issues especially if your scrum master or release manager is a well trained person in handling branching, merging, and releasing code using git.


However, in most cases, especially for a full-stack developer who did everything on its own, you may encounter an issue if:

  1. You created a project in your localhost first using R Studio and set Git as your SVN through your project setting
  2. Then you created the repo at the GitHub
  3. Finally, upon ready, you run command to sync with your GitHub

The following is the command that you use/execute and the result of running the command:

% git remote add origin [your GitHub report url]
% git pull origin master
warning: no common commits
remote: Enumerating objects: 3, done.
remote: Counting objects: 100% (3/3), done.
remote: Compressing objects: 100% (2/2), done.
remote: Total 3 (delta 0), reused 0 (delta 0), pack-reused 0
Unpacking objects: 100% (3/3), done.
From [your GitHub report url]
* branch master -> FETCH_HEAD
* [new branch] master -> origin/master
fatal: refusing to merge unrelated histories

and you see the last sentence .. ERROR


Then, based on google, you followed with the following command

% git push -u origin master

and you get the following response (or similar)

To [your GitHub report url]
! [rejected] master -> master (non-fast-forward)
error: failed to push some refs to ‘
[your GitHub report url]'
hint: Updates were rejected because the tip of your current branch is behind
hint: its remote counterpart. Integrate the remote changes (e.g.
hint: ‘git pull …’) before pushing again.
hint: See the ‘Note about fast-forwards’ in ‘git push — help’ for details.

Next, you try to pull again to get the latest branch based on the previous error by running the command to pull again

% git pull origin master

And the result is still not promising 
From [your GitHub report url]
* branch master -> FETCH_HEAD
fatal: refusing to merge unrelated histories

What are you missing or wrongly done? I won’t be able to tell you the missing or wrong steps, but I’m sharing your step to overcoming the problem.


STEPS

  1. Go to you localhost directory where you created the project
  2. In that directory, you should find a file name .gitignore & folder .git
  3. Delete both by running rm -fr (if you are using windows, the command might be different)
  4. Next, init your project file again by running the command git init. You shall see the following message appear after executing the command — Initialized empty Git repository in [your project path]
  5. Followed by adding the remote repo by running the command git remote add origin [your GitHub repo url]
  6. The followed by git add . (make sure there is ‘.’ at the end of the command). It tells the git to add all directories in the remote repo to your local.
  7. Followed by git pull origin master. If succeed, you shall be able to see the following result:
    remote: Enumerating objects: 3, done.
    remote: Counting objects: 100% (3/3), done.
    remote: Compressing objects: 100% (2/2), done.
    remote: Total 3 (delta 0), reused 0 (delta 0), pack-reused 0
    Unpacking objects: 100% (3/3), done.
    From [your GitHub repo url]
    * branch master -> FETCH_HEAD
    * [new branch] master -> origin/master
  8. Finally, run git push -u origin master to verify again. You shall see the following result to indicate it is successfully integrated between your local repo and your Github repo and R Studio shall be able to interact perfectly with GitHub.
    Branch ‘master’ set up to track remote branch ‘master’ from ‘origin’. Everything up-to-date

Once you have done all the steps, go ahead to your R Studio and perform Stage -> Commit -> Commit Message -> Push to complete the process. Refresh your Github page and you shall see all of your local files at your GitHub repo.

If you find this useful, you can buy me a coffee :) @ https://www.buymeacoffee.com/masteramuk

Share:

Saturday, April 18, 2020

Tableau Public - Apple Mobility Data and Dark Mode

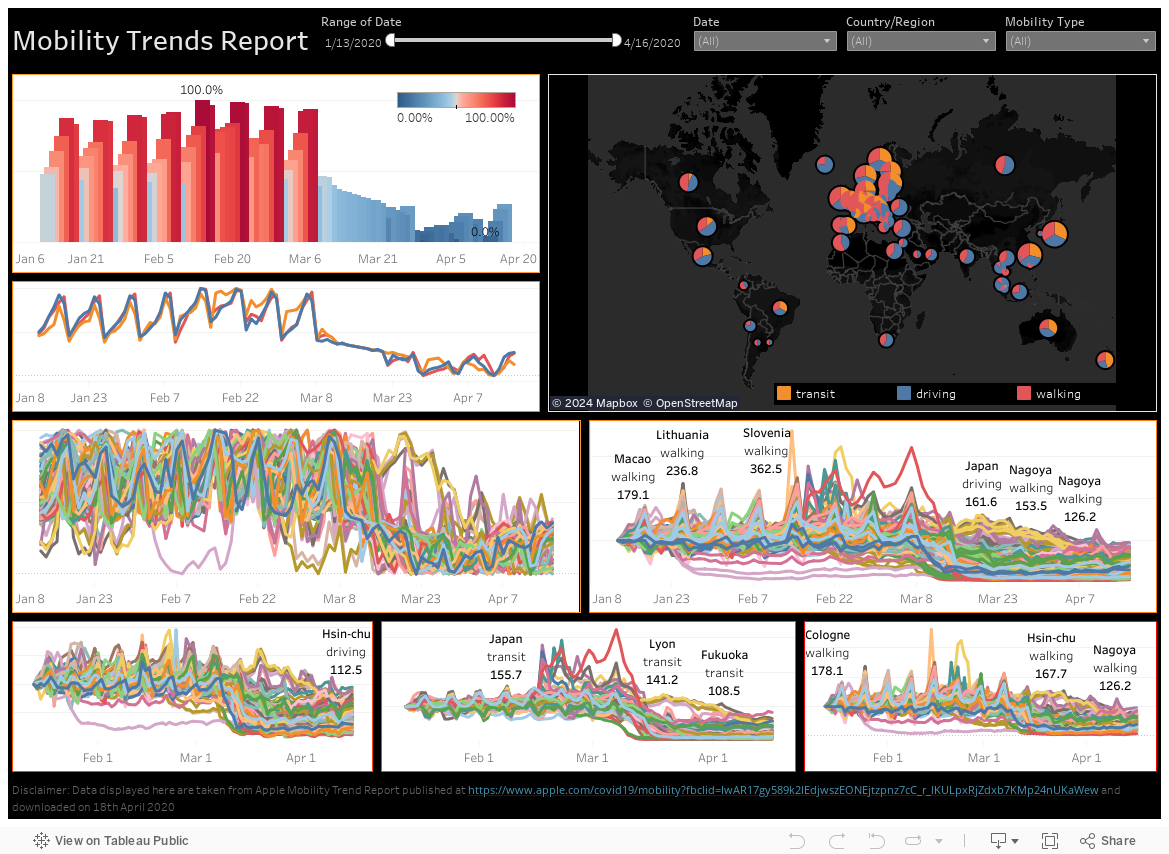
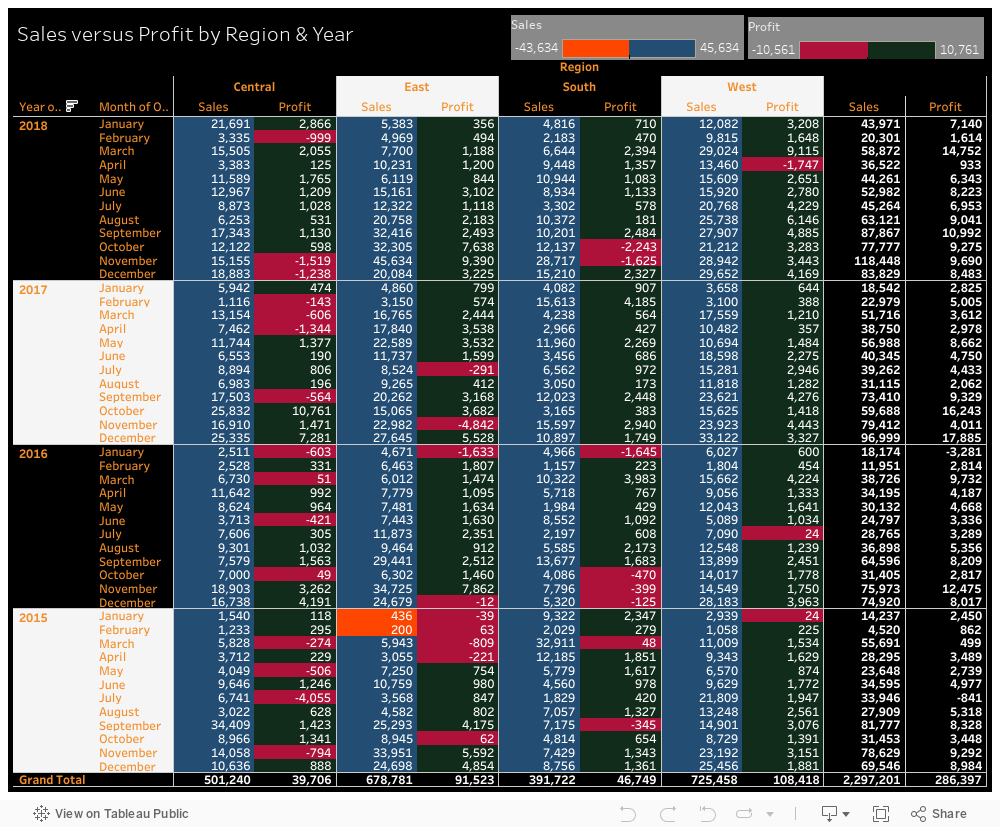
I've been working on 2 visualizations. 1 is based on Apply Mobility Data and the other is based on edited Sample Superstore.

Check it out here.

Mobility Data based on Apple's mobility data.


Grid on Dark Mode based on Tableau Sample Superstore (edited version)

All visual is available at https://public.tableau.com/profile/nurul.haszeli.ahmad#!/

All dataset is available at data.world @ https://data.world/haszeliahmad/data-analysis
Share:

Saturday, April 11, 2020

Parameter in Tableau - Using available Dimension with additional 'All' for all data

I am writing (and still writing as of this article) a manual to assist me in teaching Tableau. One of the sections is Parameter. There are many examples and guidance provided by Tableau.

You may read/view the following articles/videos for the guide on parameter.
  1. https://interworks.com/blog/interworks/2012/03/26/how-to-create-and-use-parameters-in-tableau
  2. https://help.tableau.com/current/pro/desktop/en-us/parameters_create.htm
  3. https://help.tableau.com/current/pro/desktop/en-us/changing-views-using-parameters.htm
  4. https://www.youtube.com/watch?v=CrfEJ24FWpQ
  5. https://www.youtube.com/watch?v=rJsaezoTVAE
  6. https://www.youtube.com/watch?v=opfVV1maNVw

The only problem I faced was to have an 'All' data if the user did not select any or wishes to see all data. None of them help. I tried using Action and Filters, yet it only shows based on selection and all show nothing.

That is until I found this solution.

IFNULL([FilterField],’Null’) = IF [Paramter] != ‘All’ THEN [Parameter] ELSE IFNULL([FilterField],’Null’) END
In a more readable, it will be like this

IFNULL([FilterField],’Null’) = (
     IF [Parameter] != ‘All’ THEN 
          [Parameter] 
     ELSE 
          IFNULL([FilterField],’Null’) 
     END
)

Step to:
  1. Create your parameter - In this case, you use any Dimension as the Parameter by choosing a List and choose the list by changing the Fixed section and click on Add Values From.
  2. Don't forget to add 'All' as one additional list
  3. Drag the Dimension that you used as the parameter from the Dimensions Card into Filters Card.
  4. In the Filter option, choose Condition and choose by Formula, and insert the above solution into the formula. 
  5. Don't forget to change the [FilterField] to the Dimension used for the filter and the [Parameter] to your created parameter. 
  6. Do ensure that 'All' is the same as your definition in the parameter (the character case and spelling is equal)
  7. And that shall do it. You are ready to go.


There are also an alternative solution to this and posted here: http://www.vizwiz.com/2012/09/tableau-tip-adding-all-filter-option-to.html
Share:

Thursday, April 2, 2020

Data Analysis - Use it !!

I was reading many developer's site and chat (telegram and whatsapp) when the government stated that they are looking for an app similar to Singapore apps to track the close contact of the Covid-19 positive patient.

In Singapore, they are using a technology which I presume is Bluetooth to ping close contact within the radiant of the tech and capture necessary data which then used to determine the contact and request them to perform screening. Here are some of the news:

  1. https://www.thestar.com.my/tech/tech-news/2020/03/20/covid-19-singapore-launches-contact-tracing-mobile-app-to-track-coronavirus-infections
  2. https://www.pymnts.com/coronavirus/2020/app-lets-singapore-track-virus-patients-movements/
  3. https://www.nst.com.my/news/nation/2020/03/578445/smartphone-app-track-contacts-covid-19-patients
  4. https://asia.nikkei.com/Spotlight/Coronavirus/Singapore-urges-citizens-to-sign-up-for-COVID-19-tracking-app


And the apps is available on Google Play and Apple Store

  1. https://play.google.com/store/apps/details?id=sg.gov.tech.bluetrace&hl=en
  2. https://apps.apple.com/sg/app/tracetogether/id1498276074

And as this article is written, there are many groups including international are coming with various hackathons for apps that can be used to track all COVID-19 patients and their close contact.

In Malaysia, since the announcement, many had gather groups to develop apps.

From my perspective, why must we reinvent the wheel? Why we need to develop many apps when we already have few that are potentially be used for it. 

For instance, D'scover by Favioriot was developed for a user to explore whatever the user likes but also close contact that uses the apps. I believed they can just tweak the apps to get close contact for COVID-19 and it is much faster than building and testing new apps. (by the way, this is not promoting them and I don't gain anything from it :))

Not just that apps, people have been using Google Maps, Waze, Grab, etc. All these apps collected millions of data and one of these data is people's location and whereabouts. On top of that, all telcos do have their customer's data location and track their movement. I attended the Big Data conference by Bigit a few years ago where one of the telcos presented their data analysis. They have shown the heatmap of their user and based on the communication tower.

I even had a discussion with a few telcos when they approach us (my previous company) to provide their services and wish for data sharing. I do request to have a set of data of their customer whereabouts too to ensure we can provide efficient services at the moment the customer approaches our station or hub, or at the time they are supposed to do so.

These data can be utilized to find close contact with COVID-19 patients. From these data, we know where they go, their ride and whom the came across with or pass by. Of course, these data are secured by all those companies for customer's safety and PDPA compliance. But, for the sake of government and to combat COVID-19, they can request minimal information limited to the phone number to call the respective COVID-19 contact. 

You just need a group of data scientists and data engineers to focus on the massaging and provide the relevant info to the government fast and secure. That's all :)

Don't REINVENT the wheel. Used It and MAXIMIZE the POTENTIAL.

* My personal opinion based on experience. Agreed to disagree :)


Share:

Wednesday, January 1, 2020

Tableau For Beginner

I'll be publishing an ebook on Visualizing using Tableau. To those interested, please PM ya. Here is the front page.


Share:

Saturday, November 3, 2018

Big Data - we forgot to clean our data

Recently I have been working with lots of data coming from various business area such as maintenance, financial transaction, etc., and I found an interesting thought from much top management and young leaders whom don't have enough experience handling data from the source up till visualization.

The first thing comes out from their mind was can it be done in a few hours (or some of them thought it was in a blink of the eyes or in split seconds). Normal question was "When can we see the report or chart? Can we see it tomorrow" and the worst I get "I want it to be ready by today before noon".

Image result for unclean dataMy first reaction was WTF!! (but I won't say it loud). I will normally negotiate with them as most of them don't know the process and the data that they requested. Most of them are easily attracted/amazed by superb visualization presentation by Visualization Tool's Marketing team. The thought everything can be done easily as those marketing people said. They just forgot that in a business presentation, the data set used by those marketing people are prepared and cleaned before being utilized in the tool. For example, Tableau's presentation will always use Sales data for their sample.

It is true that many of visualization tools nowadays are capable to process and display any kind of data. With certain skills, you can massage and clean your data on the fly. I've done that and I know it can be done.  BUT... surely at a cost which from my perspective, it is no beneficial at all.

Why do I say so?


  1. You cannot guarantee that the data you read is 100% clean. You might need to do lots of conversions, data massaging, replacements and calculations. This will definitely incur additional processing power and time during report population. I've come across with many data which either irrelevant, unclean (character in a supposed to be numerical column, date define as string, etc), or contain null values.
  2. You may need to perform lots of table joint or union which can cause your report server or tool to be resource hungry.
  3. You need to understand the data too. Each column and how it shall be visualize must be understood before you can present it correctly.


Related image

That's all from me..Adios


Share:

About Me

Somewhere, Selangor, Malaysia
An IT by profession, a beginner in photography

Labels

Blog Archive

Blogger templates